定位故障
challenging roots
- dynamic application structure
- develop a central running component to collect historical data and generate structure from which could analyze patterns and diagnose anomalies.
- time and effor-consuming, even unrealistic in some legacy systems
- indirect anomaly propagation
- propagation of anomaly is not bounded by the calling dependency because the calling process maybe asynchronous.
- Even anomaly occurs in a microservice that is not been called, it may affect other services in the same host or container, and cause the anomaly propagation.
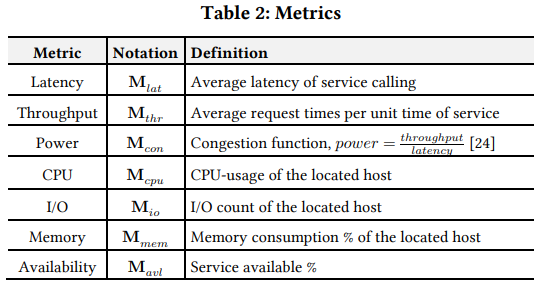
- multiple types of metric
- single type of metric is not enough to characterize the anomalies occur in diverse services
- we still lack an automated mechanism that selects them appropriately according to the characteristics of involve service
model
determine performance metrics
select a sampling interval parameter on raw metrics
small interval ⇒ redundant fluctuations, not reflect the actual calling dependency
large interval ⇒ lose effective metric changes, fail to catch the propagation topology
statistical average calling intervals

construct the anomaly behavior graph using multiple types of metrics
⭐ experiences from historical diagnosis and the characteristics of various services
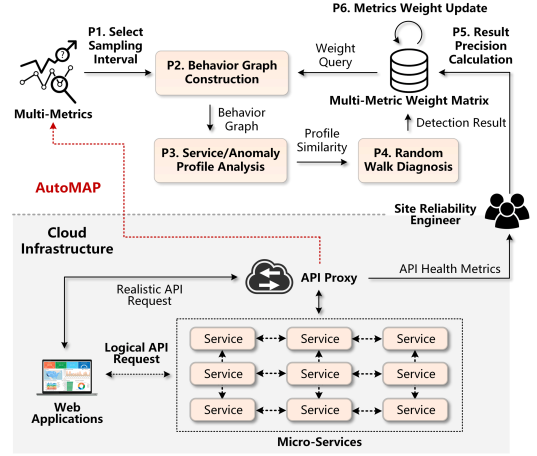
⇒ a model named Anomaly Behavior Graph to extract correlations from metrics and help us discover similar anomalies in records
four steps to construct the graph:
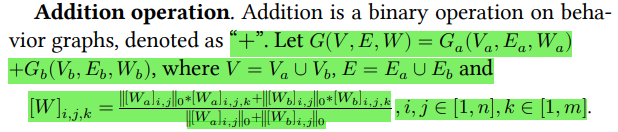
- Step1. Generate a complete, undirected and fully weighted graph G(V , E, W), where W(i,j,k) = 1 for ∀i, j ∈ [1, n] and ∀M(k), k ∈ [1, m];
- Step2. For each type of metric M(k), test conditional independence of any pairs v(i), v(j). Set W(i,j,k) = 0 if conditional independence between v(i) and v(j) is accepted;
- independent condition: given v(k) if P( vi ∩ vj | vk ) = P( vi | vk ) * P( vj | vk ) when P(vk)>0
- Step3. Remove edge e(i,j) if W(i,j,k) = 0 for ∀k ∈ [1, m]. Set W(i,j,k) ← W(i,j,k)/||W(i,j)||(0);
- Step4. Orient v-structures and the remaining edges in G.
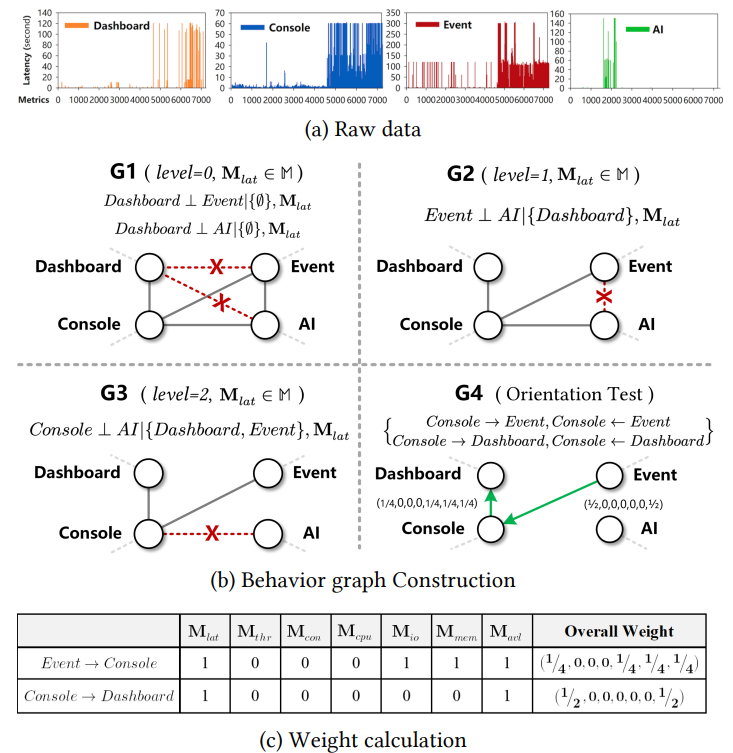
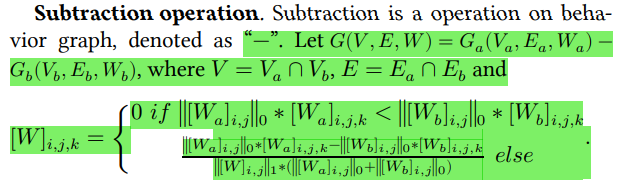
operation of add and subraction
Automated Metric Weight Learning
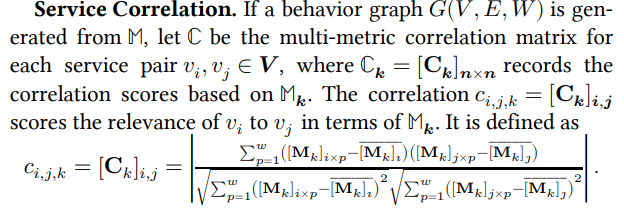
Service Correlation
- calculate the covariance of two metric series divided by the product of their standard deviations, and use the absolute value of the result as the score.
- This score measures the strength of either positive or negative linear correlation between two services.
Result Precision
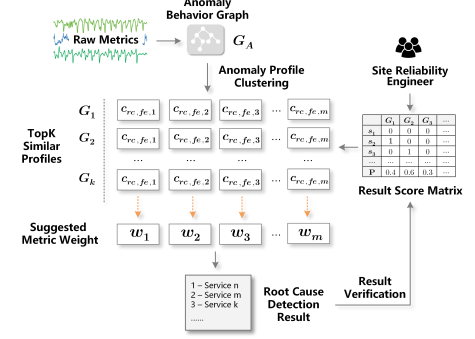
heuristic root cause detection
forward transition
if e(ij)=1, walks from service v(i) ⇒ v(j)
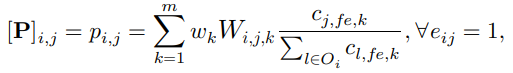
definition of probability matrix P
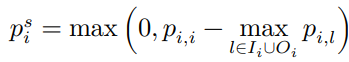
self-transition
if none of the current service’s in- and out-neighbors show high correlation, just stay longer on its currently-visiting service
denote the self-transition probability for the visiting node v(i)
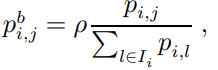
backward transition
to resolve the situation of visiting a particular service with low correlation score
the lower p is, the more constrained to the original direction; the higher p is, the more encouraged to walk backward when needed.
experiments
1. dataset
⭐ simulated and real-world
- real-world datasets consist of 20 incidents occurred in cloud platform, which is collected by SRE team.
- about 15 million metrics,
- collected during 7200 seconds (1 hour before and 1 hour after the anomaly was detected) from 1732 microservice APIs
2. baseline
compared by top-5 and average top-1 to 5 result precision
- single metric ⇒ M(lat) and M(thr)
- TBAC
- MonitorRank
- CloudRanger
- pre-defined topology ⇒ behavior graph constructed on M(lat)
- NetMedic
- MS-Rank
3. experiments
- root cause identification
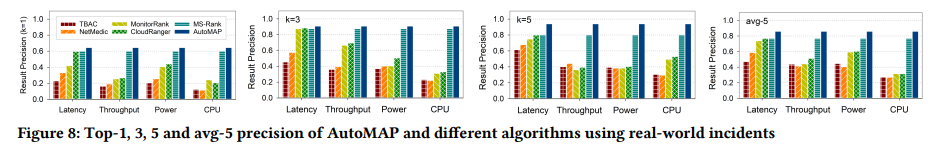
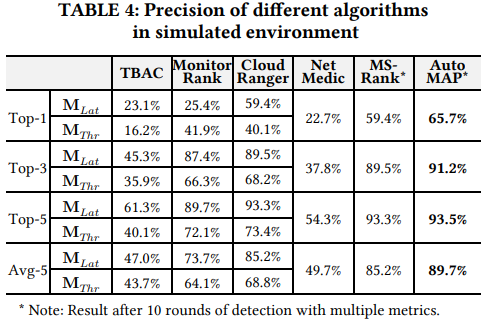
- Root cause detection is inaccurate if it’s only based on correlation score (TBAC);
- compared to static algorithms (TBAC, NetMedic, MonitorRank, CloudRanger), random walk scheme can identify the root cause with higher accuracy;
- compared with the MS-Rank algorithm, the introduction of anomaly profile in AutoMAP can effectively improve the result accuracy, especially for top-1 results.
- self-optimization
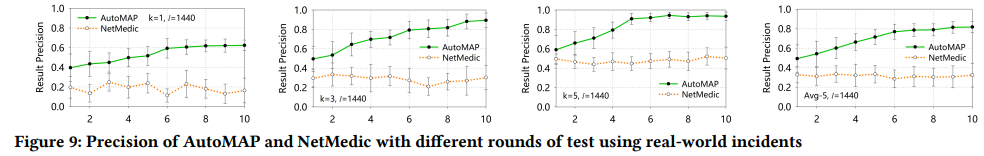
the precision of AutoMAP increases significantly when we conduct more rounds of test. As NetMedic does not support self-optimizing, so it is unstable in the rapidly changing system architecture.
- Algorithm parameter - ℓ
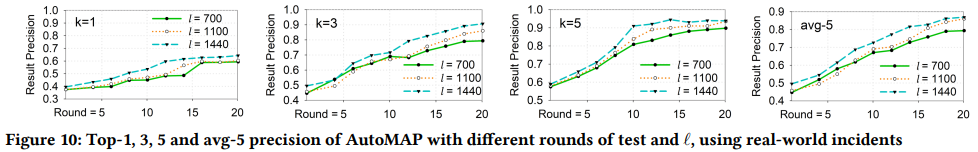
- a small ℓ results in a significant impact on the precision
- precision increases more quickly when ℓ is higher
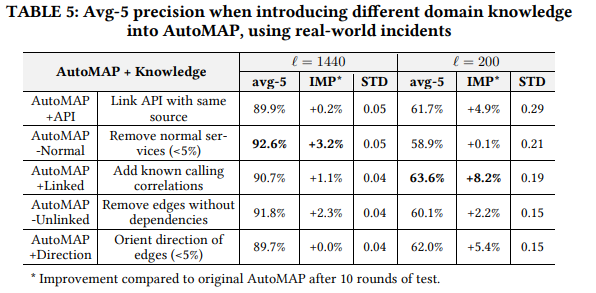
Domain knowledge
the role of domain knowledge gets weaker when more sampling data are available.
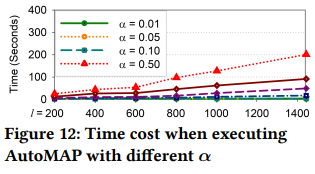
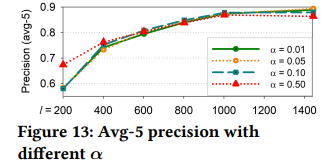
- Algorithm parameters - α and ρ
α:increased it from 0.01 to 0.50, and find the overall execution time increases linearly. When we use more metric records to run AutoMAP, the impact of using different α is not obvious.
⇒ choose a relatively small α, making the correlation graph more consistent with ground truth
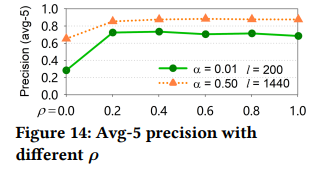
ρ:set up two environments (α = 0.01, ℓ = 200 versus α = 0.50, ℓ = 1440).
When ρ is smaller, a higher α is needed to ensure that the random walk algorithm has more paths to be chosen.
the precision is not significantly improved when ρ is set close to 1.
⇒ choose a moderate backward transition parameter, e.g., ρ =0.2.